Daily Grouping
sessionInfo()
#> R version 4.0.4 (2021-02-15)
#> Platform: x86_64-apple-darwin19.6.0 (64-bit)
#> Running under: macOS Catalina 10.15.7
#>
#> Matrix products: default
#> BLAS:   /System/Library/Frameworks/Accelerate.framework/Versions/A/Frameworks/vecLib.framework/Versions/A/libBLAS.dylib
#> LAPACK: /usr/local/Cellar/r/4.0.4/lib/R/lib/libRlapack.dylib
#>
#> locale:
#> [1] en_US.UTF-8/en_US.UTF-8/en_US.UTF-8/C/en_US.UTF-8/en_US.UTF-8
#>
#> attached base packages:
#> [1] stats     graphics  grDevices utils     datasets  methods   base
#>
#> other attached packages:
#>  [1] timeDate_3043.102      htmltools_0.5.1.1      rvest_1.0.0
#>  [4] gganonymize_0.0.0.9000 data.table_1.14.0      digest_0.6.27
#>  [7] gganimate_1.0.7        yaml_2.2.1             xtable_1.8-4
#> [10] tseries_0.10-48        tidyselect_1.1.0       sessioninfo_1.1.1
#> [13] sass_0.3.1             rmarkdown_2.7          rbokeh_0.5.1
#> [16] pander_0.6.3           scales_1.1.1           Hmisc_4.5-0
#> [19] Formula_1.2-4          survival_3.2-7         lattice_0.20-41
#> [22] knitr_1.31             summarytools_0.9.8     expsmooth_2.3
#> [25] fma_2.4                forecast_8.13          fpp2_2.4
#> [28] viridis_0.5.1          viridisLite_0.3.0      hrbrthemes_0.8.0
#> [31] rcmdcheck_1.3.3        httr_1.4.2             htmlwidgets_1.5.3
#> [34] dygraphs_1.1.1.6       xts_0.12.1             zoo_1.8-8
#> [37] av_0.5.1               ggthemes_4.2.4         png_0.1-7
#> [40] gifski_0.8.7.1         ggplot2_3.3.3          tidyr_1.1.3
#> [43] lubridate_1.7.10       readr_1.4.0            dplyr_1.0.5
#> [46] DT_0.17                ggridges_0.5.3         devtools_2.3.2
#> [49] usethis_2.0.1
#>
#> loaded via a namespace (and not attached):
#>  [1] backports_1.2.1     systemfonts_1.0.1   plyr_1.8.6          lazyeval_0.2.2
#>  [5] splines_4.0.4       crosstalk_1.1.1     pryr_0.1.4          magick_2.7.0
#>  [9] fansi_0.4.2         magrittr_2.0.1      checkmate_2.0.0     memoise_2.0.0
#> [13] cluster_2.1.1       remotes_2.2.0       extrafont_0.17      matrixStats_0.58.0
#> [17] extrafontdb_1.0     prettyunits_1.1.1   jpeg_0.1-8.1        colorspace_2.0-0
#> [21] xfun_0.21           tcltk_4.0.4         callr_3.5.1         crayon_1.4.1
#> [25] jsonlite_1.7.2      hexbin_1.28.2       glue_1.4.2          gtable_0.3.0
#> [29] pkgbuild_1.2.0      Rttf2pt1_1.3.8      quantmod_0.4.18     maps_3.3.0
#> [33] rapportools_1.0     Rcpp_1.0.6          progress_1.2.2      htmlTable_2.1.0
#> [37] foreign_0.8-81      xopen_1.0.0         RColorBrewer_1.1-2  ellipsis_0.3.1
#> [41] pkgconfig_2.0.3     farver_2.1.0        nnet_7.3-15         utf8_1.1.4
#> [45] crul_1.1.0          labeling_0.4.2      rlang_0.4.10        munsell_0.5.0
#> [49] tools_4.0.4         cachem_1.0.4        cli_2.3.1           generics_0.1.0
#> [53] evaluate_0.14       stringr_1.4.0       fastmap_1.1.0       processx_3.4.5
#> [57] fs_1.5.0            purrr_0.3.4         nlme_3.1-152        xml2_1.3.2
#> [61] compiler_4.0.4      rstudioapi_0.13     curl_4.3            testthat_3.0.2
#> [65] tibble_3.1.0        tweenr_1.0.1        bslib_0.2.4         stringi_1.5.3
#> [69] highr_0.8           gistr_0.9.0         ps_1.6.0            desc_1.3.0
#> [73] gdtools_0.2.3       Matrix_1.3-2        urca_1.3-0          vctrs_0.3.6
#> [77] pillar_1.5.1        lifecycle_1.0.0     lmtest_0.9-38       jquerylib_0.1.3
#> [81] R6_2.5.0            latticeExtra_0.6-29 gridExtra_2.3       codetools_0.2-18
#> [85] assertthat_0.2.1    pkgload_1.2.0       rprojroot_2.0.2     withr_2.4.1
#> [89] httpcode_0.3.0      fracdiff_1.5-1      parallel_4.0.4      hms_1.0.0
#> [93] quadprog_1.5-8      grid_4.0.4          rpart_4.1-15        TTR_0.24.2
#> [97] base64enc_0.1-3
A custom-defined function transforms over 12 million data points into 2309 data points giving summaries for each day in the range.
Daily datasets
Helix
helix.daily = generate_daily(helix.full)
datatable(helix.daily, options = list(pageLength = 10))
Cadillac
cadillac.daily = generate_daily(cadillac.full)
datatable(cadillac.daily, options = list(pageLength = 10))
##{-}
In addition, we can visualize the changing distribution of daily job count by year using a ridgeplot.
Plots
Helix
helix.daily %>% mutate(year = floor_date(Date,"year")) %>% ggplot(aes(x=total.jobs, y=as.factor(format(year,"%Y")), fill = stat(x))) + geom_density_ridges_gradient(scale=2, rel_min_height = 0.01) + scale_fill_viridis(name = "Number of Jobs", option="C") + theme_ipsum() + theme(legend.position="none", panel.spacing = unit(0.1, "lines"), strip.text.x = element_text(size = 8)) + scale_x_continuous(limits = c(0,20000)) + ylab("Year") + xlab("Total Jobs Run per Day") + labs(title= "Single Day Job Count by Year - Helix")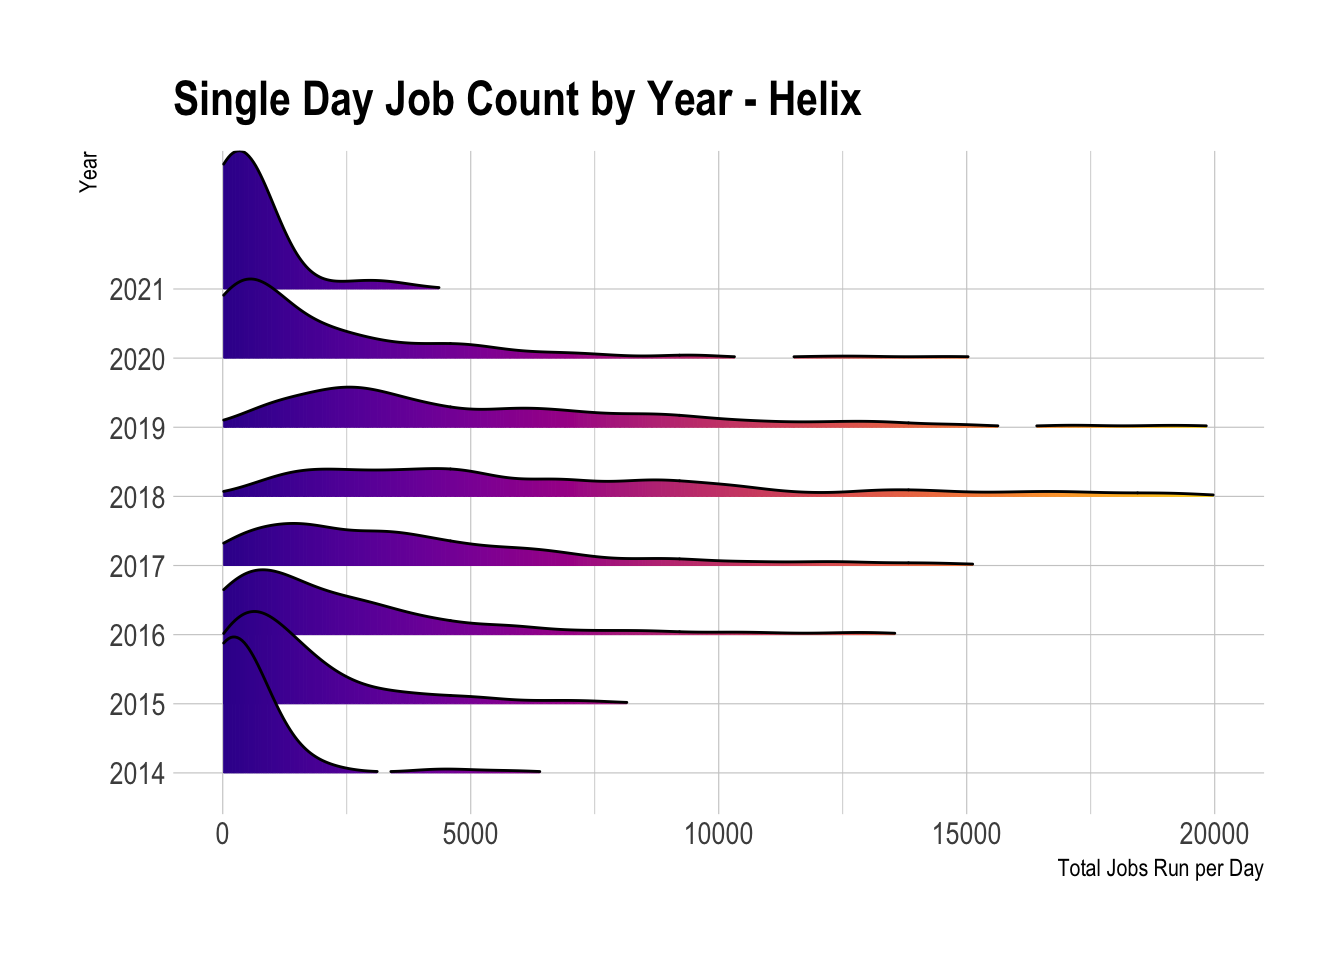
Cadillac
cadillac.daily %>% mutate(year = floor_date(Date,"year")) %>% ggplot(aes(x=total.jobs, y=as.factor(format(year,"%Y")), fill = stat(x))) + geom_density_ridges_gradient(scale=2, rel_min_height = 0.01) + scale_fill_viridis(name = "Number of Jobs", option="C") + theme_ipsum() + theme(legend.position="none", panel.spacing = unit(0.1, "lines"), strip.text.x = element_text(size = 8)) + scale_x_continuous(limits = c(0,20000)) + ylab("Year") + xlab("Total Jobs Run per Day") + labs(title= "Single Day Job Count by Year - Cadillac")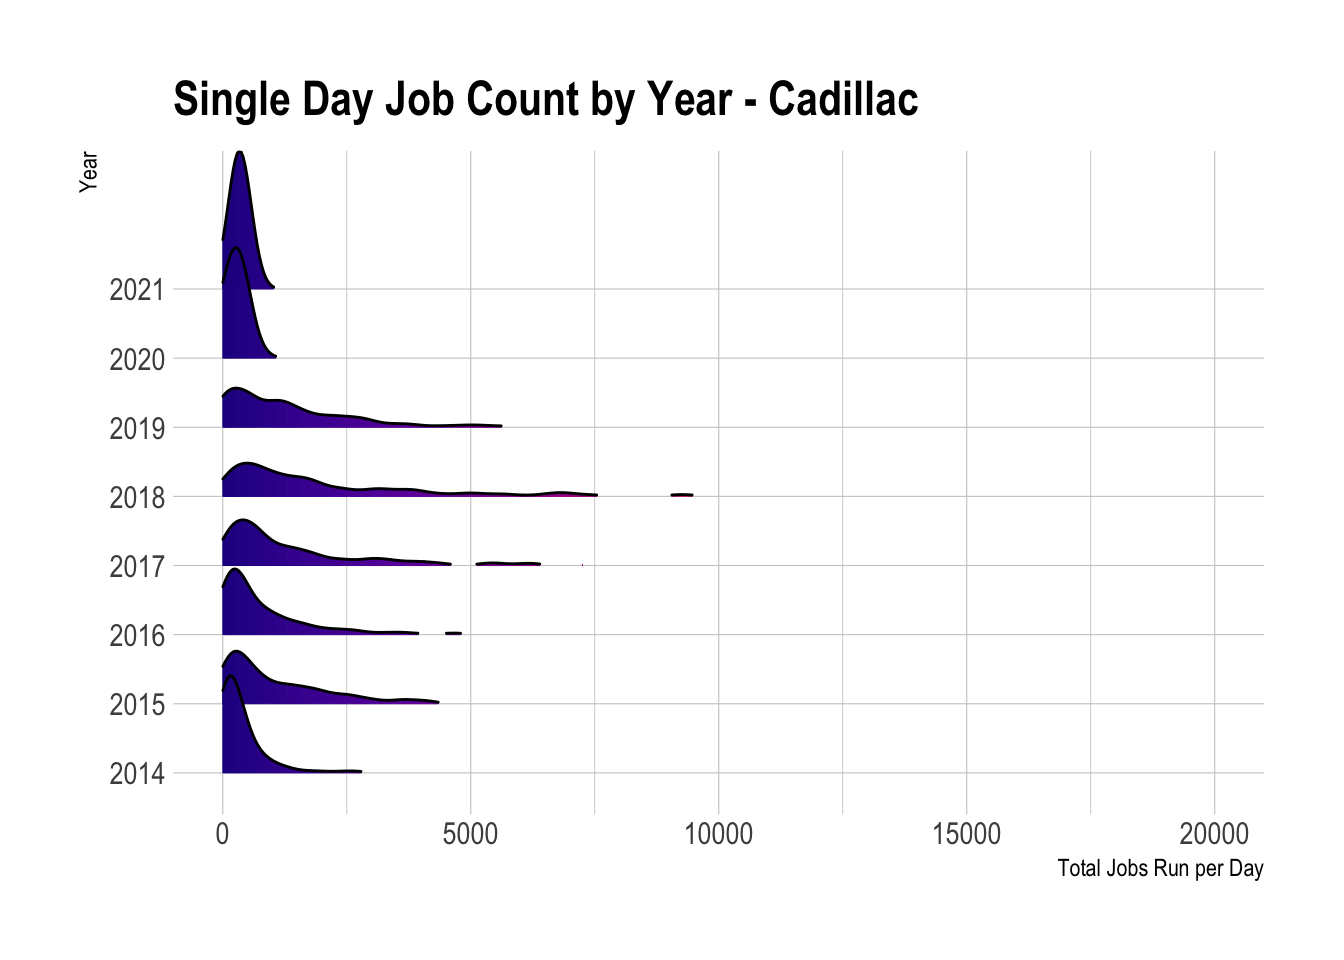 ## {-}